Turn on suggestions
Auto-suggest helps you quickly narrow down your search results by suggesting possible matches as you type.
Showing results for
Turn on suggestions
Auto-suggest helps you quickly narrow down your search results by suggesting possible matches as you type.
Showing results for
BIM Coordinator Program (INT) April 22, 2024
Find the next step in your career as a Graphisoft Certified BIM Coordinator!
- Graphisoft Community (INT)
- :
- Knowledge Base
- :
- Installation & update
- :
- How to collect Event logs/Console logs
Options
- Subscribe to RSS Feed
- Mark as New
- Mark as Read
- Bookmark
- Subscribe to Topic
- Printer Friendly Page
- Report Inappropriate Content
How to collect Event logs/Console logs
Graphisoft Alumni
Options
- Subscribe to RSS Feed
- Mark as New
- Mark as Read
- Bookmark
- Subscribe to Topic
- Printer Friendly Page
- Report Inappropriate Content
on
2020-09-11
04:34 PM
- edited on
2023-09-27
10:18 AM
by
Rubia Torres
Normally, users rarely have to deal with the Event logs and Console logs. The Technical Support team will only ask for them in some rare situations.
What is Event logs/Console logs?
There will always be a tool for collecting messages from application and system in each Operating System and writing them as logs (including operation activities, warnings, and errors). On Windows, the tool is called Microsoft Event Viewer, whereas on macOS, it is the Console app. In general, we call the logs created by these apps as Event logs and Console logs. To find and open the logs:On Windows 10:
 NOTE: Adding display information ensures that everything is captured.
 NOTE: Adding display information ensures that everything is captured.
 Here are some examples of how to collect different types of logs with Console app.
- Click Start, type Event Viewer into the search box, and then click the result, or
- Press Windows+R to open the Run dialog, type eventvwr, then press Enter
- Open Finder, navigate to Applications > Utilities folder > Console or
- Open Spotlight by pressing Command ⌘ + Space, type Console, then press Enter
Why do we need Event logs/Console logs?
In some rare situations, we may be unable to identify the crash through the crash reports; the Bug Reporter may not show up and no crash report is created; or the whole system is behaving unexpectedly (kernel panic, sudden reboot/shutdown, BSOD…). In such cases, the Event logs and Console logs may come in handy to reveal what actually happened before/during the event.How to collect the Event logs/Console logs
Depends on the situation, our developers require different kinds of logs. Please contact the Technical Support for more information.NOTE: There will be errors and warnings recorded frequently in these applications, but this is normal. Even a healthy system can still generate many warnings and errors during its operation!
On Windows 10
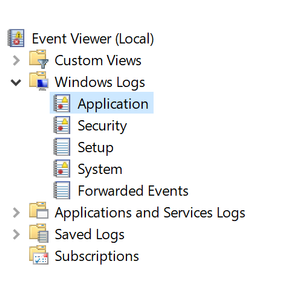
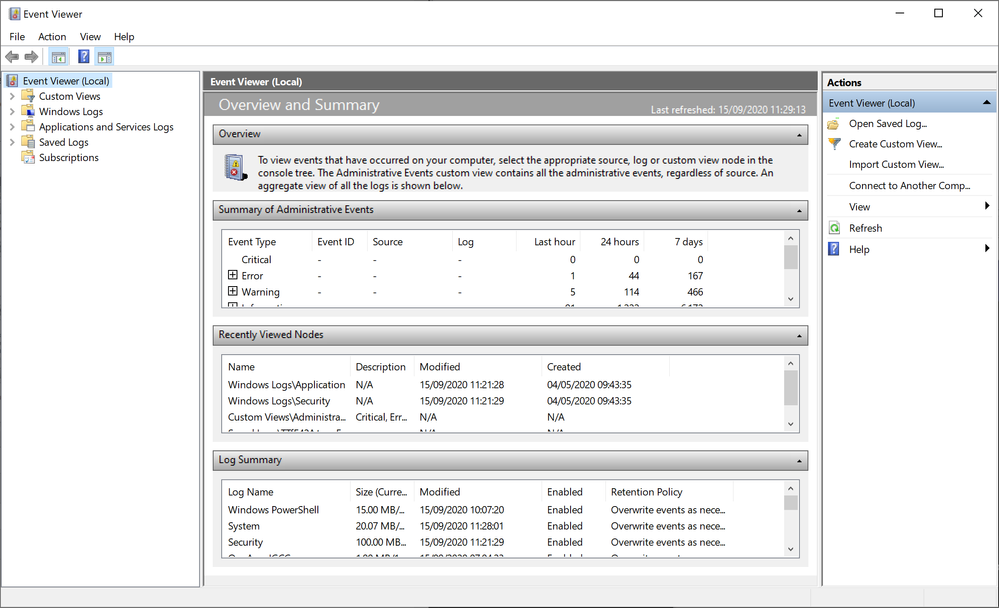
When you first open the Event Viewer, the program presents a 3-panel interface similar to this. The left panel displays a folder view, where you will find different types of event logs; the middle panel shows a list of events and their details in the Preview Pane; the right panel gives you some quick actions to choose from.
Collect Application logs
- Click the small arrow to expand Windows Logs folder on the left panel, and then select Application.
- On the menu bar, click Action, select Save All Events As (or right-click Application > select Save All Events As)
- Name the file, and click the Save button.
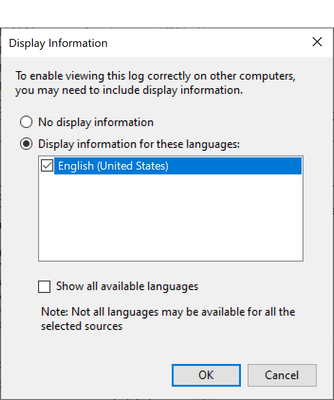
- If the Display Information dialog appears, please select the option Display information for these languages, choose English (United States) and click OK. The log will be saved with .EVTX extension

Collect System logs
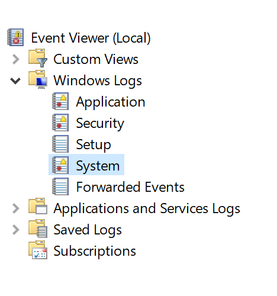
- Click the small arrow to expand Windows Logs folder on the left panel, and then select System logs.
- On the menu bar, click Action, select Save All Events As (or right-click System logs > select Save All Events As)
- Name the file, and click the Save button.
- If the Display Information dialog appears, please select the option Display information for these languages, choose English (United States) and click OK. The log will be saved with .EVTX extension.

On macOS
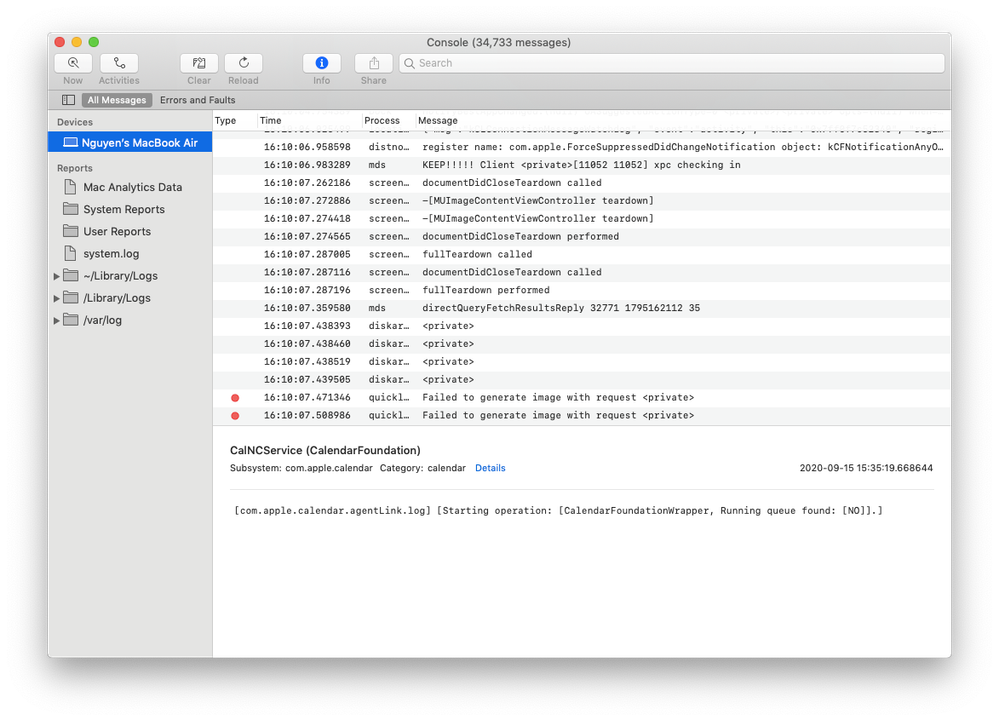
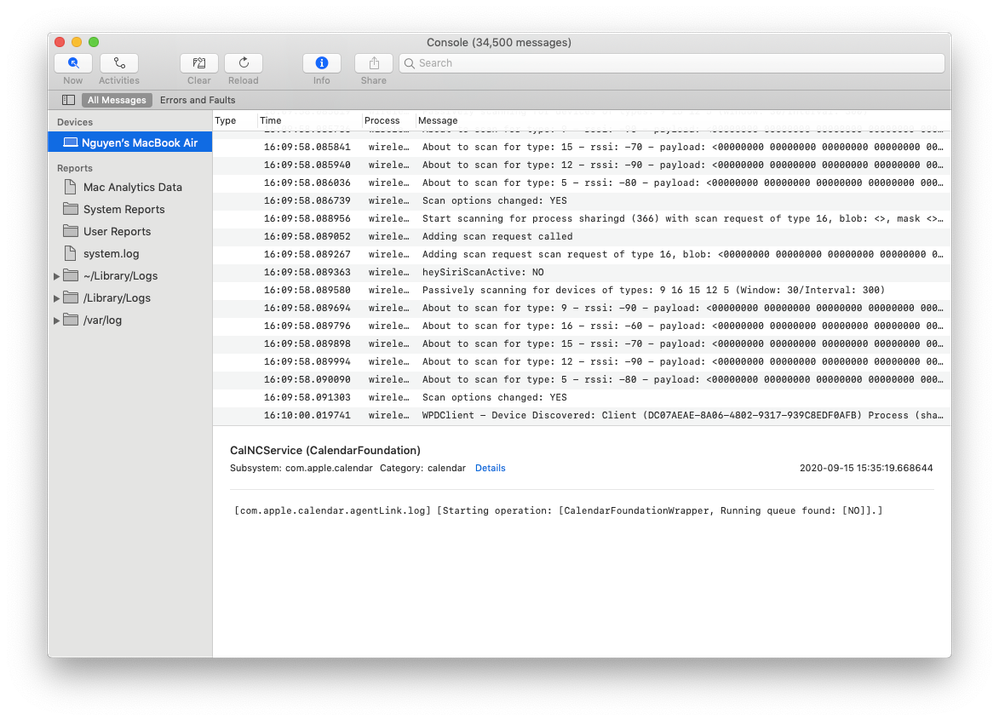
In the Console app, you may see that not only your Macbook is listed, but also other devices. The Console app can display logs collected by your computer and other connected devices. Depending on the version of the macOS you’re using, the interface could be slightly different, but it will always contain similar components:- A sidebar to select devices, or system and application reports,
- A toolbar across the top with basic functions,
- The main window showing the list of events or reports collected.

Collect log messages of device's activities
Use Console app to view and collect log messages collected by your computer.- Select the device from the list in the sidebar (under Devices section) to monitor its activities
- Try to replicate the issue a few times
- Go back to Console app, and select any recent error message from the main window
- Select all messages by going to the menu bar, Edit > Select All (or Command ⌘ + A), and copy them using Command ⌘ + C or Edit > Copy
- Open any text editor (for example TextEdit app) on macOS and create a new file. Paste the copied content there and save it as a text file
- Forward the text file to the Technical Support team.
Collect Console reports about system and apps.
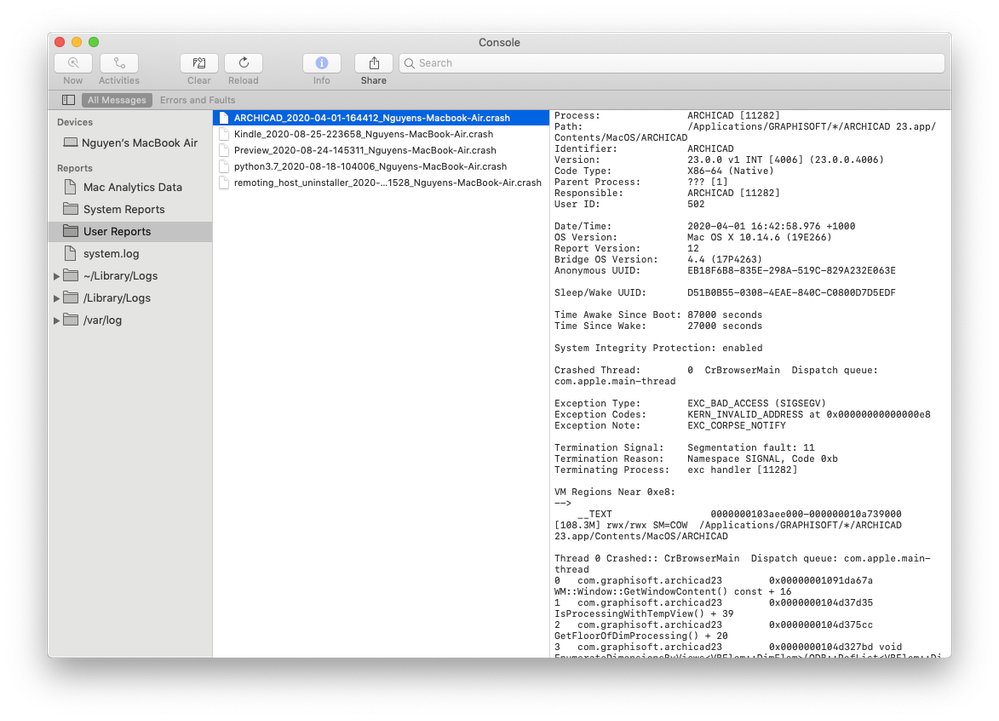
Console app creates various reports that provide general diagnostic data, system and apps operation details. If you are logged in as an administrator user, you can see all reports on that machine.- Select a category in the Reports section
- Look for the required file. Crash reports have .crash extension, other reports from the system may have .diag or .hang extension.
- macOS 10.15 (Catalina): the Crash reports have a dedicated section.
- macOS 10.14 (Mojave) or lower: the Crash reports can be found in the User reports section, whereas other system reports are placed in the System reports section
- Right-click the report > Reveal in Finder
- Copy the report(s) and forward it to the Technical Support team
Related articles
