Turn on suggestions
Auto-suggest helps you quickly narrow down your search results by suggesting possible matches as you type.
Showing results for
Turn on suggestions
Auto-suggest helps you quickly narrow down your search results by suggesting possible matches as you type.
Showing results for
- Graphisoft Community (INT)
- :
- Forum
- :
- Visualization
- :
- Re: a render and memory problem
Options
- Subscribe to RSS Feed
- Mark Topic as New
- Mark Topic as Read
- Pin this post for me
- Bookmark
- Subscribe to Topic
- Mute
- Printer Friendly Page
Visualization
About built-in and 3rd party, classic and real-time rendering solutions, settings, workflows, etc.
a render and memory problem
Anonymous
Not applicable
Options
- Mark as New
- Bookmark
- Subscribe
- Mute
- Subscribe to RSS Feed
- Permalink
- Report Inappropriate Content
2007-10-10
05:08 PM
- last edited on
2023-05-11
12:24 PM
by
![]() Noemi Balogh
Noemi Balogh
2007-10-10
05:08 PM
I've got myself a little problem here with rendering a model. Here's the situation:
I have a very simple model -- 17 slabs, 1 mesh (about 22000 polys), and 15 objects (parapicture by Dwight), total under 23000 polys -- I'm running AC11 EDU on a Toshiba Satellite Pro Laptop 2Ghz, 2GB, Nvidia GeForce Go 7600 w 256 dedicated / 512 shared, running vista 32bit.
Here's the problem:
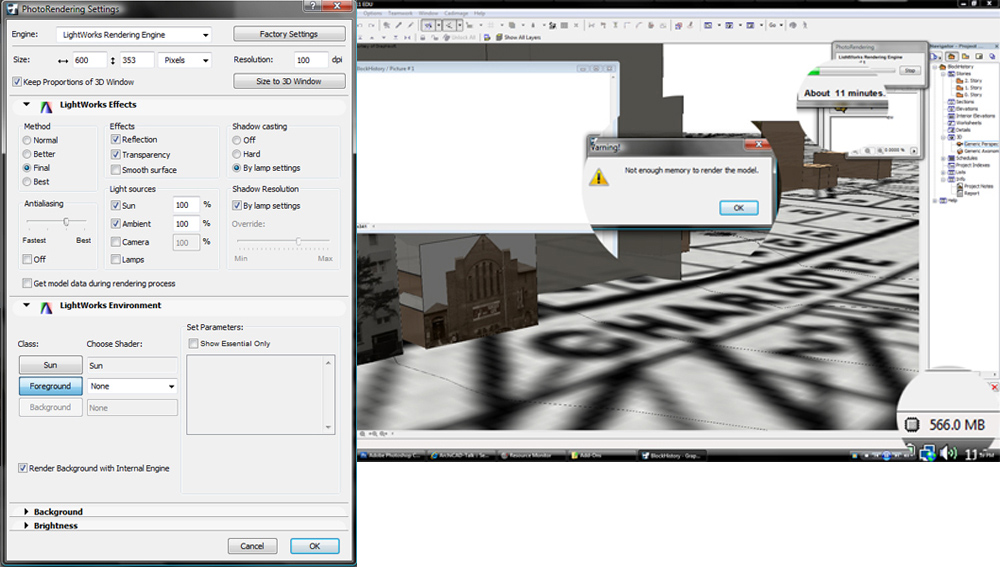
using the lightworks rendering engine with settings as per attached image, i get a 'not enought memory to render the model' error. Even on such a small model i'm getting an estimated rendering time of up to 22mins and it stops with 566mb still free in the physical memory. I've rendered far more complex models than this and never got an estimation over a minute.
I tried turning off the mesh (now a total of 212polys) and recived the same error with 538mb still free. It was working temporarily (still giving a 22 min estimation but rendering in less than 1min ) with 'get model data during render' checked in the LW dialogue, but when i tried to do it again to get evidence for this post it didn't work (687.9mb free)... i tried another couple of times and each time the error was happening and amounts of physical memory available increased (687.6mb free & 715.2mb free).
So with the mesh off, and the only other elements being simple slabs and roofs, i can only assume that the 'parapicture' object (from obj despository - object displays an image on a plane/ billboard) is the item that is causing complications... there are 15 of these in total ( only half of which are actually in the (un)rendered scene) which means a total of 15 jpeg and tiff images that are being loaded into the model... i'll admit they are of a decent resolution, but i wouldn't say extreme.
So i opened another project that is a bit more complex (total 66000 polys) that has some billboard tree objects in it. there are 12 of these, each loading 2 images, so 24 fairly high resolution images and this model rendered in about 30secs and the available physical memory got down to about 280mb.....
well i'm stumped... anybody got a suggestion?
4 REPLIES 4
Anonymous
Not applicable
Options
- Mark as New
- Bookmark
- Subscribe
- Mute
- Subscribe to RSS Feed
- Permalink
- Report Inappropriate Content
2007-10-10 05:15 PM
Options
- Mark as New
- Bookmark
- Subscribe
- Mute
- Subscribe to RSS Feed
- Permalink
- Report Inappropriate Content
2007-10-10 06:04 PM
2007-10-10
06:04 PM
Hi there,
check first how big those texture map bitmaps in size. I don't really suggest to use a texture more than 200KB. I ran into this problem when i maped a big satilite picture (46km2) on a mesh surface. so try to compress the jpg as much as u can.
If that's not the case let me know and we have to find the problem somewhere else.
PS. Also helps if you switch to wireframe internal egine prior rendering. OpenGL still eats up a lot of physical memory in 11. 9 was even worse.
Mishi Szabo
Urban Strategies Inc.
---------
Dual QuadCore Xeon Intel Mac 8GB Memory
Urban Strategies Inc.
---------
Dual QuadCore Xeon Intel Mac 8GB Memory
Anonymous
Not applicable
Options
- Mark as New
- Bookmark
- Subscribe
- Mute
- Subscribe to RSS Feed
- Permalink
- Report Inappropriate Content
2007-10-11 04:58 AM
2007-10-11
04:58 AM
Hi Mishi, thanks for your reply.
I've done some more diagnosing and here are the results....
I had a look at the image sizes as you suggested. As i mentioned in the first post, i'm comparing between two projects, Project1 (problem file) has fewer images than project2 and the sizes are much smaller. The image files are fairly large though, the largest image size in the problem file is 6mb and all the others are less than 1mb. in the second project, however, the highest file size is 16mb and the rest are all OVER 5mb, and this project renders fine with twice as many images loaded compared to the problem file... so while i acknowledge that the images are quite large, i can't understand how that can be the root cause of the problem because it's not happening universally....
Next i tried turning off all the image objects in the problem file (just to be
Next i tried zooming out to show all the objects in the project and funnily enough it actually rendered despite there now being more than double the number of images within the rendered view... i can only assume that the amount of detail loaded from each image is directly related to how close the image is to the camera...? even so there was now twice as many images to load into the rendering.... funky (it's worth noting that the render time estimation is still more than 20-30 times too much)
next i tried only turning off the images one at a time, to see if there was a gradual decrease in the render time and the time estimation. the effect was minimal... only a very slight decrease in render time with the decrease in the number of images....
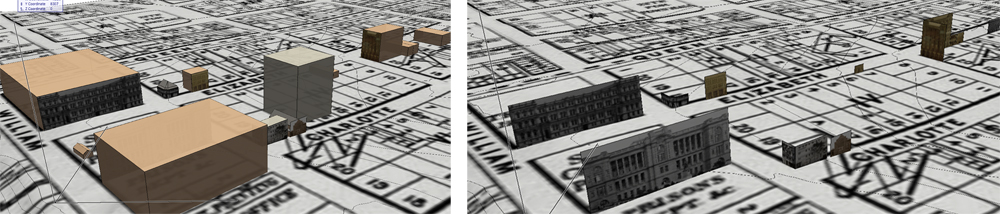
Next i turned off all the slabs and roofs so that each image object was completely exposed to the camera ( see attached image to explain) and now the render crashes again with a 'not enough memory' error message, which would suggest that it couldn't handle the number of images that it had to render... this is odd because as you can see in the image, the slabs all have a transparency to them, so even with them turned on, it still has to render at least a small part of every image... again this would suggest that the problem has something to do with how much of the images are loaded.... or how much detail from each images is loaded...? maybe the engine decreases the image resolution at will??
I also tried your other suggestion, mishi, and turned the 3d model to internal engine wireframe. this actually had the opposite effect to what you suggested, the render crashed, on the same view, and this time archicad was reporting over 1GB of available ram at the time of the crash... i switched back to open gl, shaded, and it rendered again... in open gl, the image loaded into the object is displayed in the 3d window, whereas in wireframe, obviously, it's not... again this suggests the problem has something to do with how much of the image the engine has to load...
unfortunately this doesn't appear to be a stable problem.... i zoomed back in to try and re-render the view that was causing the problem in the first place, and this time it rendered.... i'm really confused
incidently... in the problem file, the images types are jpeg and a tiff, in the other file, which renders fine, the images types are tga...
hmmm, if anyone has some insight it would be much appreciated,
thanks
I've done some more diagnosing and here are the results....
I had a look at the image sizes as you suggested. As i mentioned in the first post, i'm comparing between two projects, Project1 (problem file) has fewer images than project2 and the sizes are much smaller. The image files are fairly large though, the largest image size in the problem file is 6mb and all the others are less than 1mb. in the second project, however, the highest file size is 16mb and the rest are all OVER 5mb, and this project renders fine with twice as many images loaded compared to the problem file... so while i acknowledge that the images are quite large, i can't understand how that can be the root cause of the problem because it's not happening universally....
Next i tried turning off all the image objects in the problem file (just to be
Next i tried zooming out to show all the objects in the project and funnily enough it actually rendered despite there now being more than double the number of images within the rendered view... i can only assume that the amount of detail loaded from each image is directly related to how close the image is to the camera...? even so there was now twice as many images to load into the rendering.... funky
next i tried only turning off the images one at a time, to see if there was a gradual decrease in the render time and the time estimation. the effect was minimal... only a very slight decrease in render time with the decrease in the number of images....
Next i turned off all the slabs and roofs so that each image object was completely exposed to the camera ( see attached image to explain) and now the render crashes again with a 'not enough memory' error message, which would suggest that it couldn't handle the number of images that it had to render... this is odd because as you can see in the image, the slabs all have a transparency to them, so even with them turned on, it still has to render at least a small part of every image... again this would suggest that the problem has something to do with how much of the images are loaded.... or how much detail from each images is loaded...? maybe the engine decreases the image resolution at will??
I also tried your other suggestion, mishi, and turned the 3d model to internal engine wireframe. this actually had the opposite effect to what you suggested, the render crashed, on the same view, and this time archicad was reporting over 1GB of available ram at the time of the crash... i switched back to open gl, shaded, and it rendered again... in open gl, the image loaded into the object is displayed in the 3d window, whereas in wireframe, obviously, it's not... again this suggests the problem has something to do with how much of the image the engine has to load...
unfortunately this doesn't appear to be a stable problem.... i zoomed back in to try and re-render the view that was causing the problem in the first place, and this time it rendered.... i'm really confused
incidently... in the problem file, the images types are jpeg and a tiff, in the other file, which renders fine, the images types are tga...
hmmm, if anyone has some insight it would be much appreciated,
thanks
Options
- Mark as New
- Bookmark
- Subscribe
- Mute
- Subscribe to RSS Feed
- Permalink
- Report Inappropriate Content
2007-10-11 06:04 PM
2007-10-11
06:04 PM
Ok. I think i forgot to tell you something.
I still find your texture sizes too big. So Try to make the pixel size itself smaller. I know you will loose quality, but i believe this way you will be fine. So let's say if that giant OS texture on the base mesh 3400x2200 @ 200 dpi, save a jpg version like 1200xSomething @ 72 dpi. And do this with all the textures what you map on surfaces. I have a penny on it this time you will have no problem. and stick with JPG. TIFF is big and you don't use alphachannel anyway.
Try it...
Mishi Szabo
Urban Strategies Inc.
---------
Dual QuadCore Xeon Intel Mac 8GB Memory
Urban Strategies Inc.
---------
Dual QuadCore Xeon Intel Mac 8GB Memory
Suggested content
- Cineware by maxon add-on has unexpectedly closed. - Windows, all Archicad versions - Solution in Visualization
- Interior Render Black in Visualization
- Artlantis (v. 2021) - problem with final rendering in Visualization
- working on a large modelling file in Installation & update
- Mep connection randomly is losing its properties and connections doesnt work. Archicad 24-26 in Modeling
Didn't find the answer?
Check other topics in this Forum
Back to ForumRead the latest accepted solutions!
Accepted SolutionsStart a new conversation!
